How to Calculate Blended ROAS (and Why It Beats Channel ROAS)
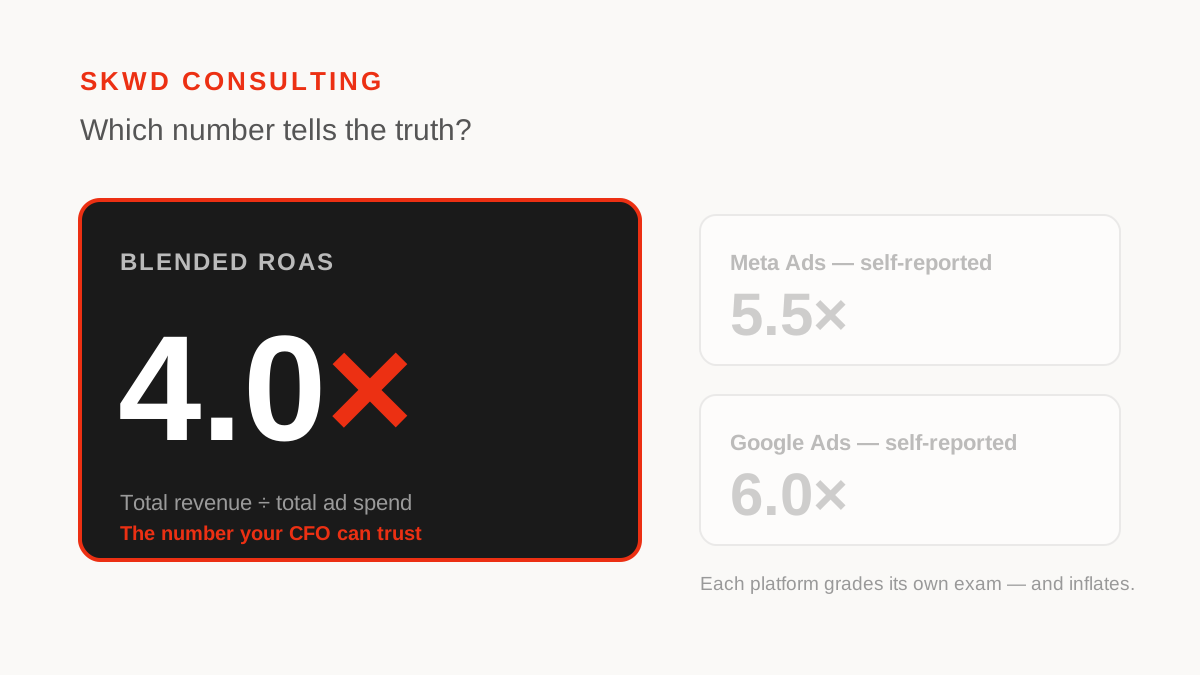
Blended ROAS is your total revenue divided by your total ad spend across every channel. If you spent ₹10 lakh on ads last month and the business made ₹40 lakh, your blended ROAS is 4.0. That single number — one you can't fake with attribution tricks — is the one we watch first for every brand we scale.
Most teams don't track it. They track channel ROAS: the return each platform reports for itself. And that's where the money quietly leaks. In this post we'll cover how to calculate ROAS, how blended ROAS differs, and why the channel numbers on your dashboard are almost always lying to you.
What ROAS actually measures
ROAS stands for Return On Ad Spend. It answers one question: for every rupee you put into ads, how many rupees of revenue came back?
The formula is simple:
ROAS = Revenue from ads ÷ Cost of ads
- Spend ₹1,00,000, generate ₹3,00,000 in revenue → ROAS of 3.0 (often written 3× or 300%).
- Spend ₹1,00,000, generate ₹1,50,000 → ROAS of 1.5.
Higher is better, but "good" depends entirely on your margins. A jewellery brand with 70% gross margin thrives at 2× ROAS. A grocery brand at 12% margin can be losing money at 4×. ROAS is a revenue ratio, not a profit ratio — remember that, because it's the trap most founders fall into.
ROAS vs. break-even ROAS
Your break-even ROAS is simply 1 ÷ your gross margin. At 25% margin, you break even at 4.0 — anything below that and you're paying customers to buy from you. Knowing this one number tells you whether your "3× ROAS campaign" is a win or a slow bleed. It's the first thing we set up when we build clean attribution and margin-aware dashboards.
Channel ROAS: the number your dashboards report (and inflate)
Channel ROAS is the return a single platform claims for itself — Meta's Ads Manager showing 6×, Google Ads showing 5×, and so on. It's useful for optimising within a platform. As a measure of business performance, it's dangerously misleading for three reasons.
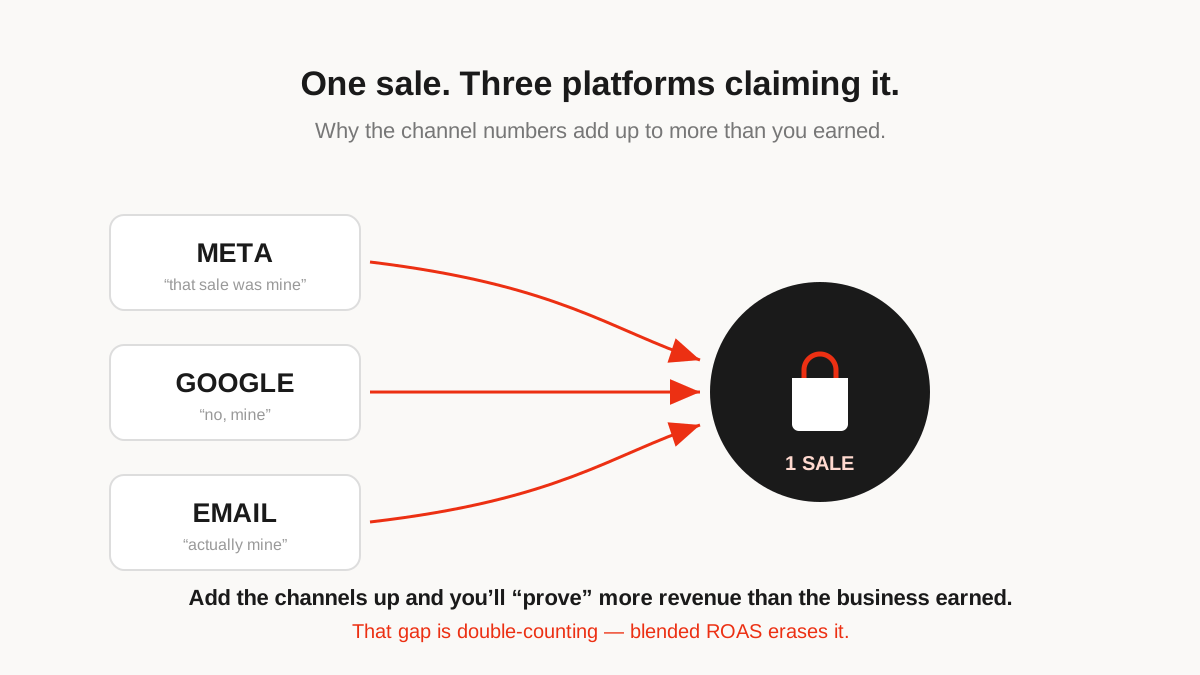
1. Platforms take credit for sales they didn't create. Meta and Google both count a conversion if they touched the customer anywhere in the journey. A single sale often gets claimed by Meta and Google and your email tool. Add up the channel numbers and you'll "prove" you made more revenue than the company actually earned. Google's own guide to attribution is candid about this: every model is a different opinion about who deserves credit for the same sale.
2. They over-count branded and returning customers. When someone who already loves your brand searches your name and clicks an ad, the platform books full credit — even though that sale would have happened anyway. Channel ROAS looks fantastic; incremental value is near zero.
3. Every platform is graded by its own exam. You'd never let a salesperson report their own quota with no audit. Channel ROAS is exactly that — each platform marking its own homework, tuned to make you spend more.
Here's the giveaway. Add your channel-reported revenue together and compare it to what actually landed in your bank account:
| Channel | Ad spend | Reported revenue | Reported ROAS |
|---|---|---|---|
| Meta Ads | ₹4,00,000 | ₹22,00,000 | 5.5× |
| Google Ads | ₹3,00,000 | ₹18,00,000 | 6.0× |
| YouTube / programmatic | ₹3,00,000 | ₹8,00,000 | 2.7× |
| Total | ₹10,00,000 | ₹48,00,000 (sum of channels) | — |
| Actual total revenue | ₹40,00,000 | — |
The channels claim ₹48 lakh between them. The business actually made ₹40 lakh. That ₹8 lakh gap is pure double-counting — the same sales claimed by more than one platform — and it's why decisions made on channel ROAS lead to overspending on channels that look good on paper.
How to calculate blended ROAS
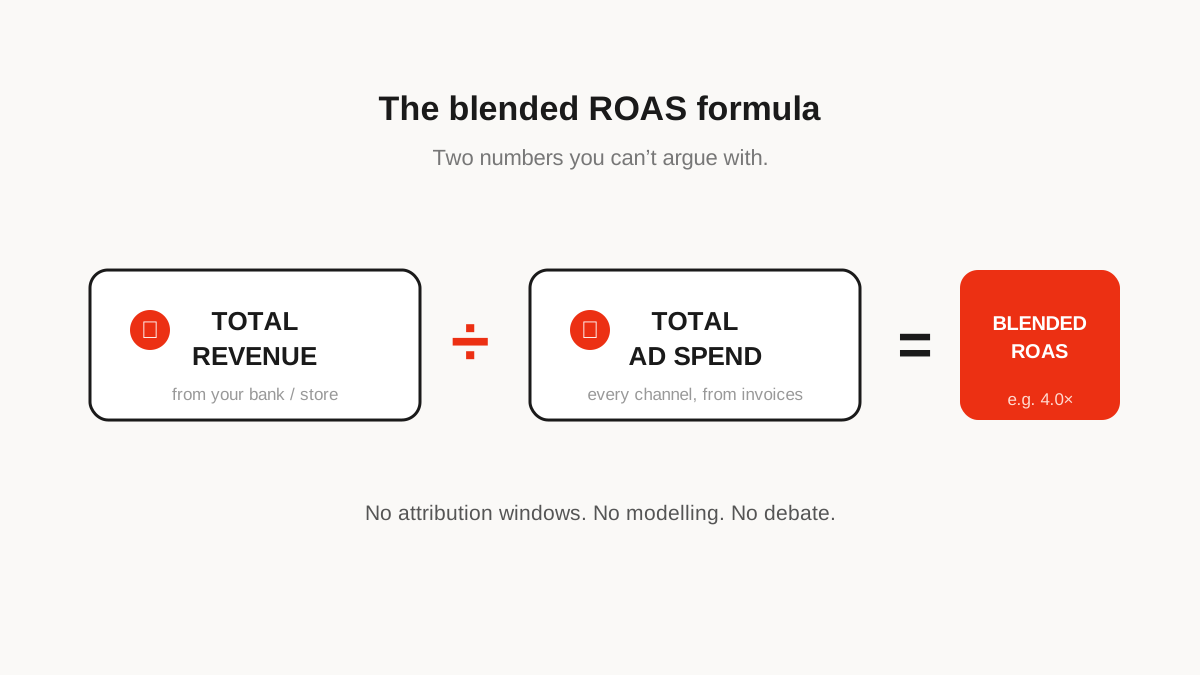
Blended ROAS ignores the platform reports entirely and works from two hard numbers you can't argue with: total revenue and total spend.
Blended ROAS = Total revenue (all sources) ÷ Total ad spend (all channels)
Follow these steps:
- Add up all ad spend for the period — Meta, Google, YouTube, programmatic, influencer, everything. From the table above: ₹4L + ₹3L + ₹3L = ₹10,00,000. Use your actual invoices, not platform estimates.
- Take total revenue from your source of truth — Shopify, your ERP, your bank — not the sum of dashboards. Here that's ₹40,00,000.
- Divide revenue by spend. ₹40,00,000 ÷ ₹10,00,000 = blended ROAS of 4.0 — versus the flattering 5.5× and 6.0× the platforms reported for themselves.
That's it. No attribution windows, no modelling, no debate. One number the whole team — including your CFO — can trust.
Make it profit-aware: blended MER and contribution margin
Marketers often use MER (Marketing Efficiency Ratio), which is the same idea — total revenue ÷ total marketing spend. The real upgrade is watching blended ROAS against contribution margin: revenue minus cost of goods, shipping, payment fees, and ad spend. A blended ROAS of 3.0 that grows contribution margin beats a 6.0 that doesn't, every time. Revenue is vanity; margin is the number that pays salaries.
Channel ROAS vs. blended ROAS: when to use each
You need both — for different jobs.
| Channel ROAS | Blended ROAS | |
|---|---|---|
| What it measures | One platform's self-reported return | Whole-business return on all ad spend |
| Best for | Optimising within a channel (which ad, which audience) | Deciding total budget and whether growth is profitable |
| Weakness | Double-counts, over-credits, self-graded | Doesn't tell you which channel drove a change |
| Who should watch it | The media buyer on the dials | The founder and finance team |
Use channel ROAS to steer the car; use blended ROAS to decide whether the trip is worth taking. When a channel's numbers soar but blended ROAS stays flat, you've found spend that's taking credit rather than creating growth. That's usually the first thing worth cutting — and it's the whole reason we do media buying run by people who read the P&L.
A simple way to sanity-check every month
Pull one screenshot and one bank figure:
- Sum of all channel-reported revenue (from each platform).
- Actual total revenue (from your store or accounting).
The bigger the gap, the more your channels are double-counting — and the more you should be steering by blended ROAS. Track blended ROAS and contribution margin side by side each month, and scale only what grows both.
FAQ
What is a good ROAS?
There's no universal number — a "good" ROAS is anything comfortably above your break-even ROAS (1 ÷ gross margin). A high-margin brand can profit at 2×; a low-margin one might need 5×. Always judge ROAS against your own margins, not an industry benchmark.
How is blended ROAS different from channel ROAS?
Channel ROAS is what a single platform reports for itself, using its own attribution. Blended ROAS is total revenue ÷ total ad spend across all channels, taken from your actual books. Blended can't be inflated by double-counting, which is why it's the more honest measure of business performance.
Is blended ROAS the same as MER?
Nearly. MER (Marketing Efficiency Ratio) is total revenue ÷ total marketing spend — the same top-down logic. Some teams include non-ad marketing costs (tools, agency fees) in MER and keep blended ROAS to media spend only. Pick one definition and apply it consistently.
Does blended ROAS work if I only run one channel?
Yes, and if you truly run a single ad channel, blended and channel ROAS will be close. The gap appears — and blended ROAS earns its keep — the moment you run two or more channels that can each claim the same sale.
Should I stop looking at channel ROAS entirely?
No. Channel ROAS is still the right tool for optimising inside a platform. Just don't use it to judge overall performance or set total budget — that's blended ROAS's job.
The bottom line
Channel ROAS tells you how each platform thinks it's doing. Blended ROAS tells you how the business is actually doing — and it's the number that stops you from scaling spend that only looks profitable. Calculate it monthly, watch it next to contribution margin, and let the platform dashboards fight over the credit.
If your channel numbers look great but growth doesn't reach the bank, that's exactly the gap we diagnose first. Book a free strategy call and we'll show you your real blended ROAS in the first two weeks.